In Los Angeles and Santa Monica classrooms, students can now use maps that not only show them where places are – but when.
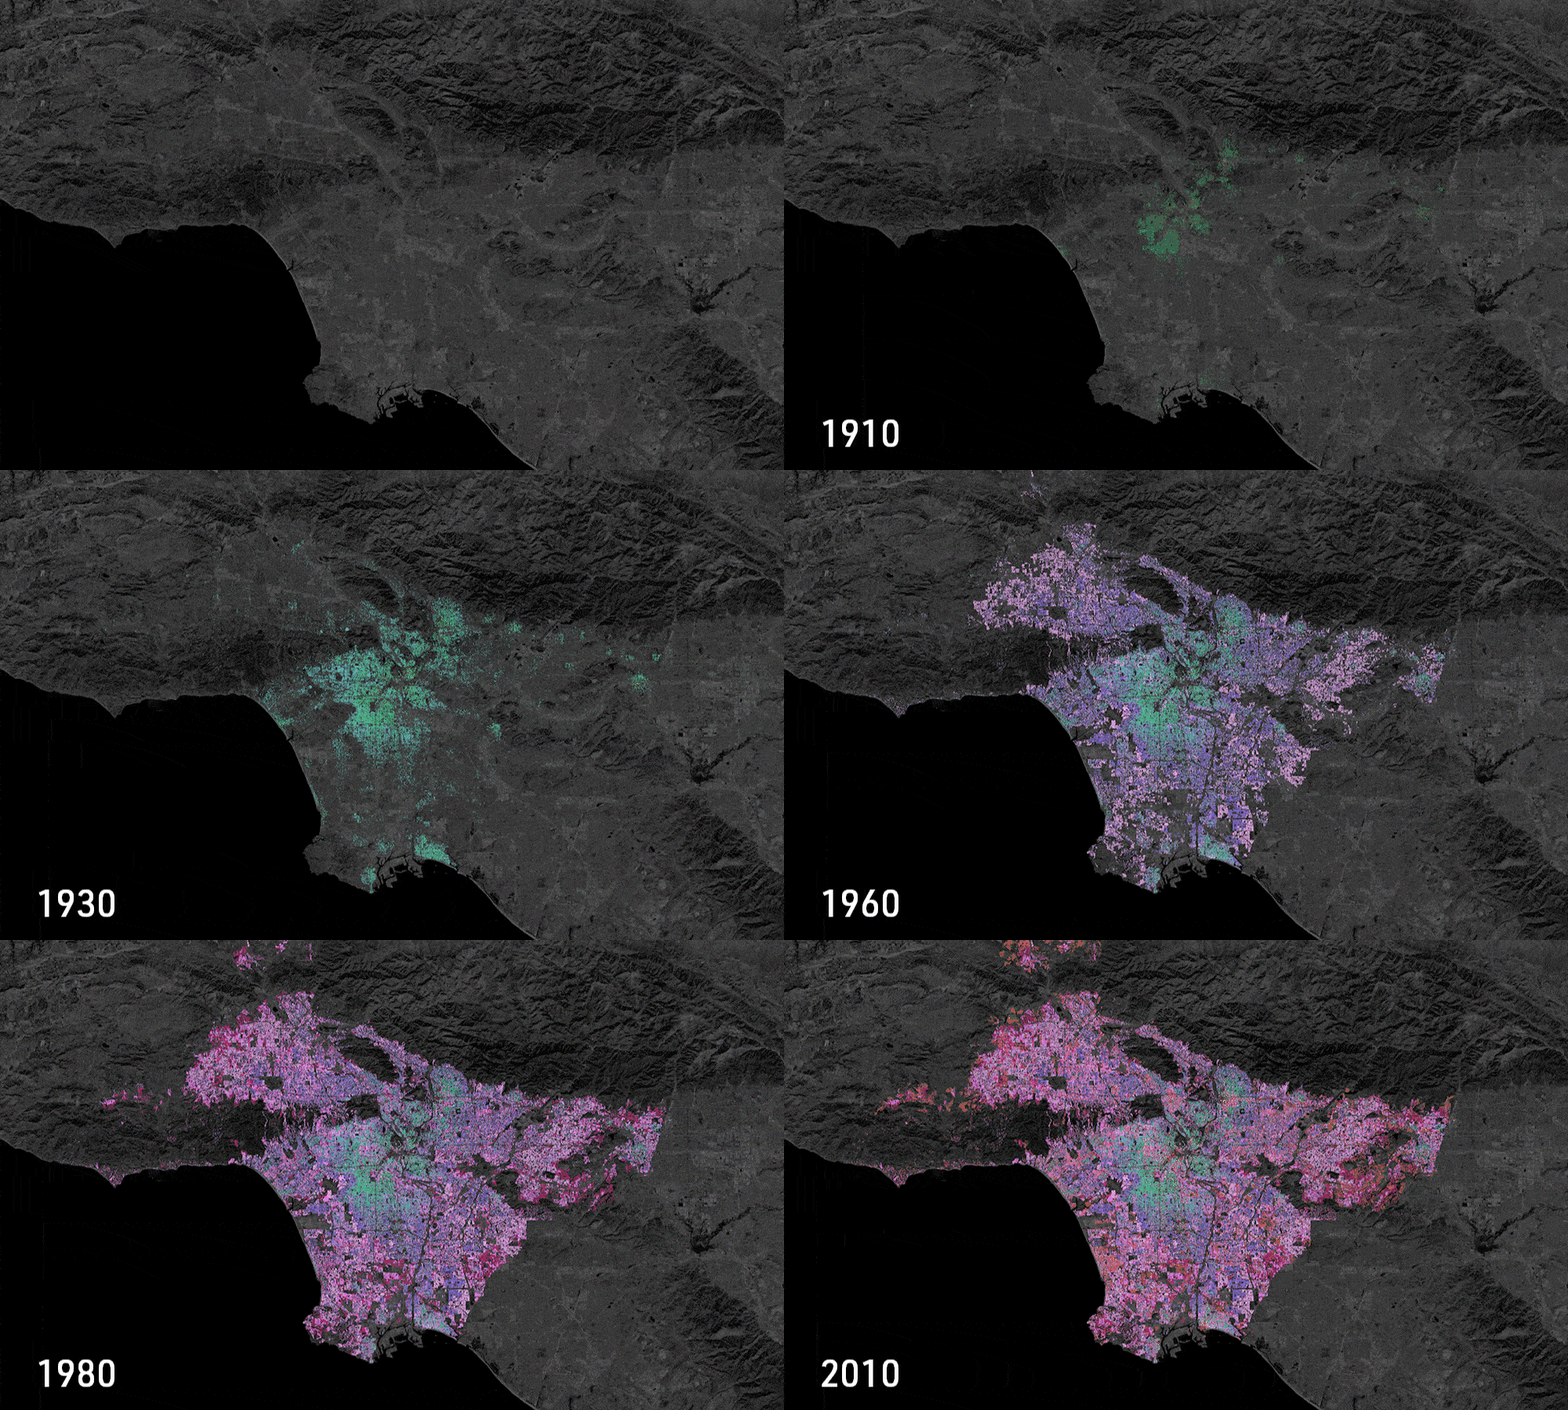
With the click and drag of a mouse, high schoolers go back in time to see Los Angeles County before European settlers. Cities like Inglewood, Carson or Long Beach are marked by their indigenous names: Tajuata, Swaanga and Wa’aachvet. Another map shows students how L.A. urbanized over time, from a sparsely populated area in the 1890s to bustling metropolis of 2010.
These digital maps – developed by Annette M. Kim, director of Spatial Analysis Lab (SLAB) at the USC Sol Price School of Public Policy – have helped 18 teachers create innovative lesson plans for science, history and ethnic studies. With the ability to visualize the languages and cultures connected to L.A., the maps also help teachers comply with a new California law requiring American cultures and ethnic studies education in high school. Students, meanwhile, get practice conducting their own research.

“These interactive maps are really engaging to the students,” Kim said. “They get excited about finding where they are on the map, seeing their cultural background and are curious to explore other cultures and places.”
The maps were created as part of The City Talks, a collaboration of linguists, urbanists and other academics who develop digital maps and data visualizations projects. The group received a $150,000 grant from the American Council of Learned Societies, in part to create an American culture and ethnic studies curriculum at K-12 public schools.
One teacher using the SLAB maps is Isabel Cortes, a U.S. history teacher at Venice High School. She asked students to explore a map that shows the cultural hubs within Los Angeles, using a database of 6 million signs on major streets across the county. The map identifies distinct cultural centers such as the Japanese community in Torrance, as well as melting pots like Downtown L.A., where Greek, Korean, Mexican and many other cultures overlap.
With the help of the maps, students in Cortes’ classroom have produced reports on L.A. cultural landmarks and created guides to Los Angeles. The lessons have helped students identify cultures they did not know existed and think about whether they see themselves on the map, Cortes said. The project also allows students to reflect on their cultural identities while conducting interviews with community members to learn more about L.A.’s cultural hubs, she added.
“One of the biggest challenges I see in our education system is we have textbooks and a lot of lectures, and students are just regurgitating the answers sometimes,” Cortes said. “This project is asking them to reflect on their own positions of privilege and power and their own cultural wealth to expand their understanding of what community means to them.”
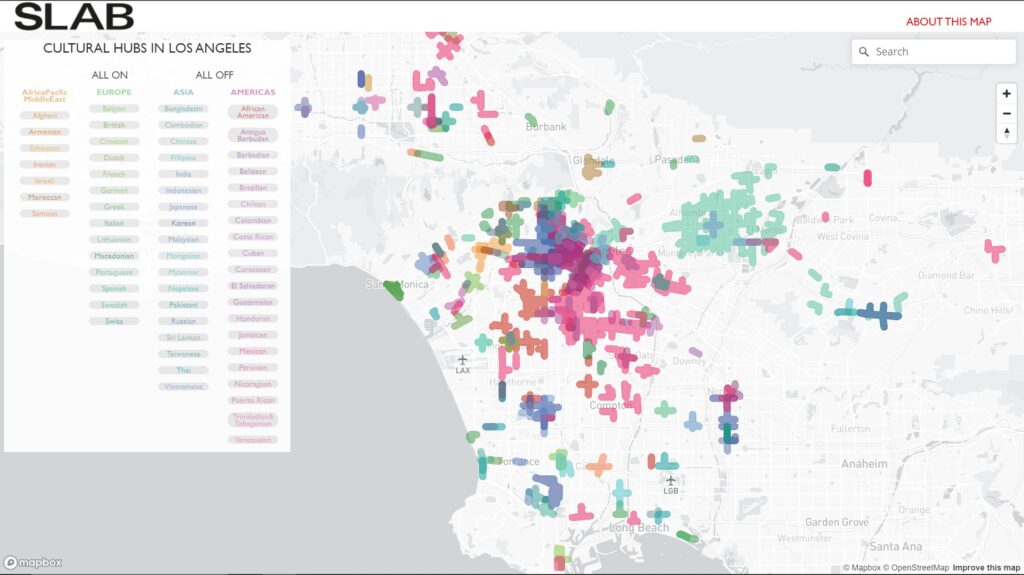
The cultural hub map has even found its way into a marine biology classroom. Another teacher in Venice used the map as an analogy to show that it’s natural for people (and animals) to congregate with others who are like them, Kim said.
Kim’s collaboration with teachers comes as educators and elected officials reconsider the way they teach history, culture and ethnicity. Some states like California are encouraging schools to dive into subjects like racism, justice and equality. Others, such as Florida, have pushed in the opposite direction, banning so-called critical race theory.
Kim sees the maps as a way for people to better understand America’s cultural and complicated history. The indigenous map, for example, is meant to make people feel more grounded to the native history that is literally right underneath their feet.
Master of Urban Planning
Make Cities More Just, Livable & Sustainable
USC’s MUP degree trains students to improve the quality of life for urban residents and their communities worldwide.
Find Out More“To some, native history is like a fairy tale, faraway land. They don’t realize they are right on top of it,” Kim said. “I’m doing this to lay a new cognitive map foundation for people to realize where they stand in a new way, because I grew up in the public education system in California, and now I feel like I was so miseducated. There’s so many things I didn’t know.”
In Santa Monica High School, ethnic studies teacher Marisa Silvestri uses the urbanization by decade map to teach students about eminent domain. Silvestri assigns groups different areas of L.A. that were affected by eminent domain, such as Chavez Ravine and Sugar Hill. The maps, which show population growth in neighborhoods, give them a tool to ask and answer their own questions, making the project more like an academic inquiry or investigative journalistic report than a traditional lesson, she said.
“It really empowers them and puts them in charge of their own learning,” Silvestri said. “Instead of me lecturing to them about something, it’s really led by what they want to know.”
